
Bitcoin Technical Analysis Summary
What comes next for Bitcoin?

Bitcoin has been trading in a tight sideways consolidation pattern for approximately 57 days, representing one of the more compressed ranges in its history on a percentage basis. Historical precedent from a similar consolidation in November of the prior year, which lasted 68 days before resolving lower, suggests a potential resolution window of roughly 10-11 days from the time of the analysis.
Key Levels and Pattern Observations
Support / Bullish Bias: The structure maintains a slight bullish bias as long as Bitcoin holds above the low of the key reversal candle, with a critical daily close below $62,750 required to invalidate this bias and signal potential breakdown.
Descending Trend Line: A downward-sloping trend line connects the January high pivot and constrains upside movement.
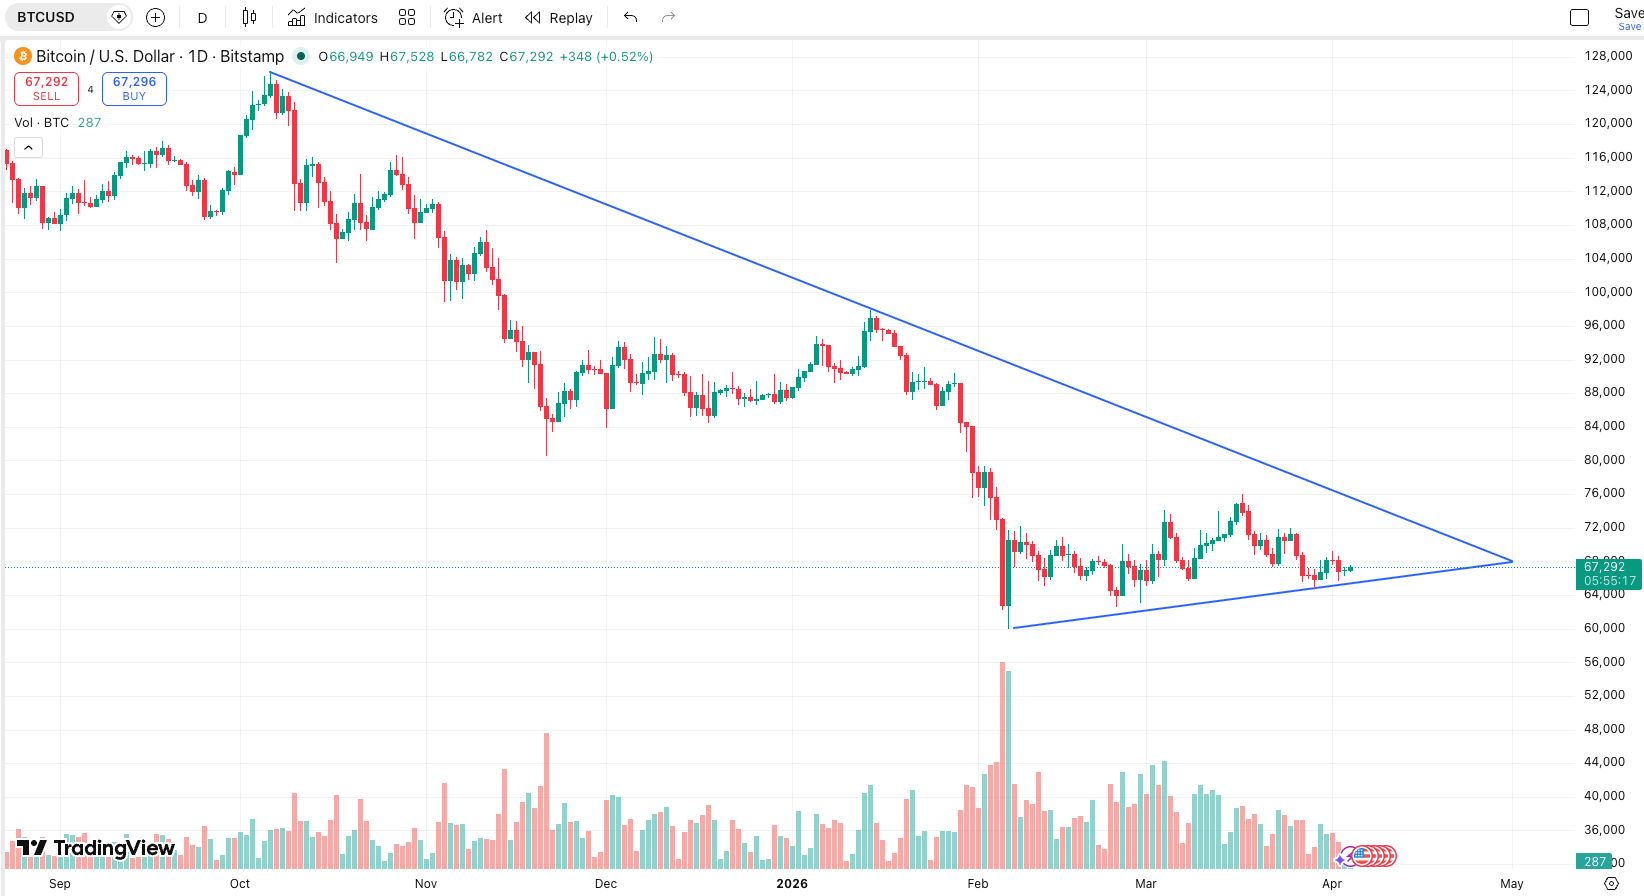
Wedge Pattern: Bitcoin is forming a wedge that is expected to reach apex within approximately 11 days (around mid-April, notably near tax day in the United States). This compression implies an imminent resolution, either a breakout above the wedge or a breakdown below the $62,750 support level. The move need not wait the full period; a decisive break could occur sooner.
Potential Scenarios Upon Resolution
Bullish Breakout: A confirmed close above the wedge would target a retest of the prior consolidation zone, with measured upside potential of 18-25% over the following 3-4 weeks, implying a move toward the $80,000-$85,000 region. Longer-term, clearing that could open the path to $100,000, with best-case toward a new all-time high near $132,000 along the prevailing long-term trend line.
Bearish Breakdown: A daily close below $62,750 would target the next major support zone near a prior pivot low, offering approximately 15-16% downside. In a severe worst-case scenario (e.g., broad market collapse or adverse regulatory developments), maximum drawdown could extend toward the long-term trend line connecting the 2020 low, around $30,000, completing a head-and-shoulders pattern.
Current Position Context
This setup emphasises patience: monitor for a clear breakout or breakdown, then align exposure accordingly. Upside offers attractive risk/reward, while downside permits averaging or exit strategies at defined support.
Long-Term Perspective
Regardless of near-term direction, the broader technical framework highlights defined risk levels on both sides. A breakout and sustained advance above $85,000 would reinforce bullish continuation toward six-figure territory, while violation of major support would test deeper corrective zones without necessarily invalidating the longer-term secular uptrend. Bitcoin traders should monitor volume and candle closes around the identified thresholds for confirmation.