
The bearish case for Bitcoin: major sell signals flashing 📉🐻🔻🚨⚠️💀🔴
The bearish case for Bitcoin

Bitcoin recently topped out at $109k before reversing sharply, showing clear signs of weakness. While many bulls remain optimistic, the price action suggests that the market structure is shifting, and the risks are mounting. Historically, using our custom TradingView Algorithm indicator, similar patterns have led to prolonged downturns, making now a critical time to reassess expectations.

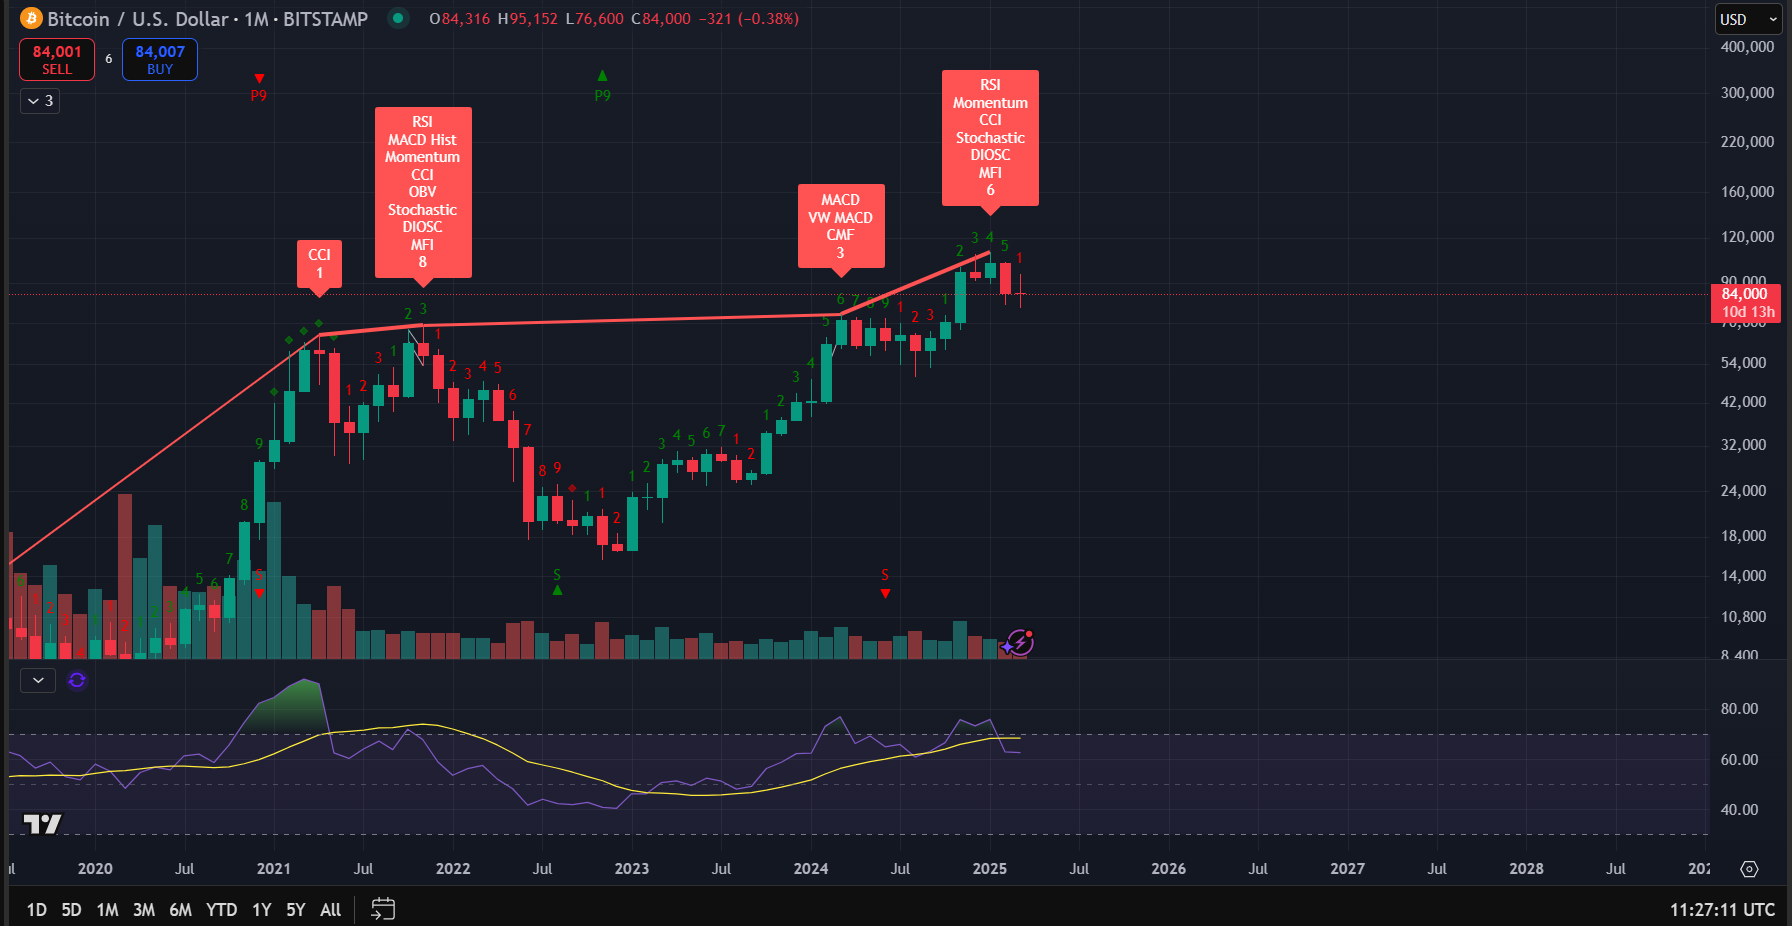
Monthly Chart: Topping Signals Flashing
Looking at the monthly timeframe, Bitcoin has formed a structure reminiscent of previous cycle tops. Our analysis of historical cycles shows that:
CCI (Commodity Channel Index) overbought signals have historically marked cycle peaks. This indicator recently flashed, aligning with past major tops.
RSI (Relative Strength Index) shows buyer exhaustion, similar to previous Bitcoin market tops, suggesting momentum is waning.
MACD (Moving Average Convergence Divergence) bearish cross is forming, which has led to significant selloffs in past Bitcoin cycles.
These confluences suggest that Bitcoin may be forming a local top, with downside risks substantially outweighing further upside potential.
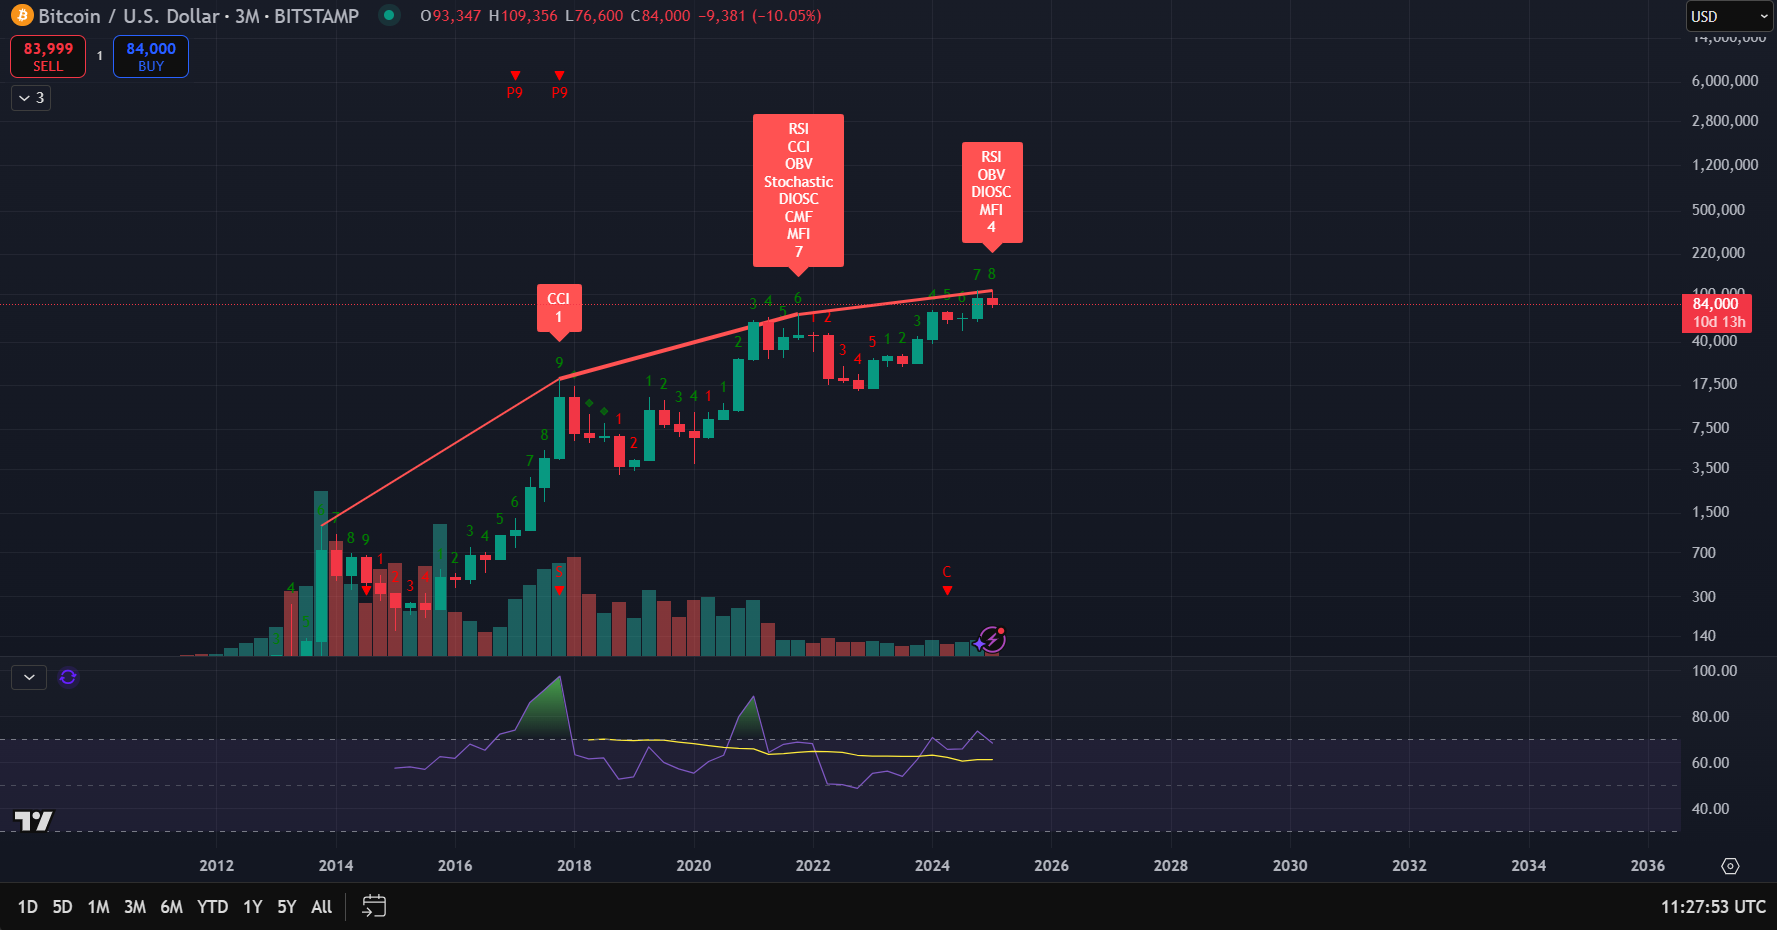
Three-Month Chart: The Most Bearish Setup Yet
Zooming out to the three-month timeframe, the bearish case is even stronger. This timeframe has predicted every major bear market in Bitcoin’s history.
CCI and RSI both signal overextension, which historically precedes deep corrections. Watch out below 📉🐻.
MACD and VWAP MACD indicate waning momentum, aligning with previous cycle tops. Very concerning, on the larger time scale.
OBV (On-Balance Volume) shows distribution, meaning large holders are selling into strength. Corporations may become the new bag holders.
Every time these indicators fired together in past cycles, Bitcoin saw major pullbacks of 50-80%. If history repeats, a significant drawdown could be ahead.
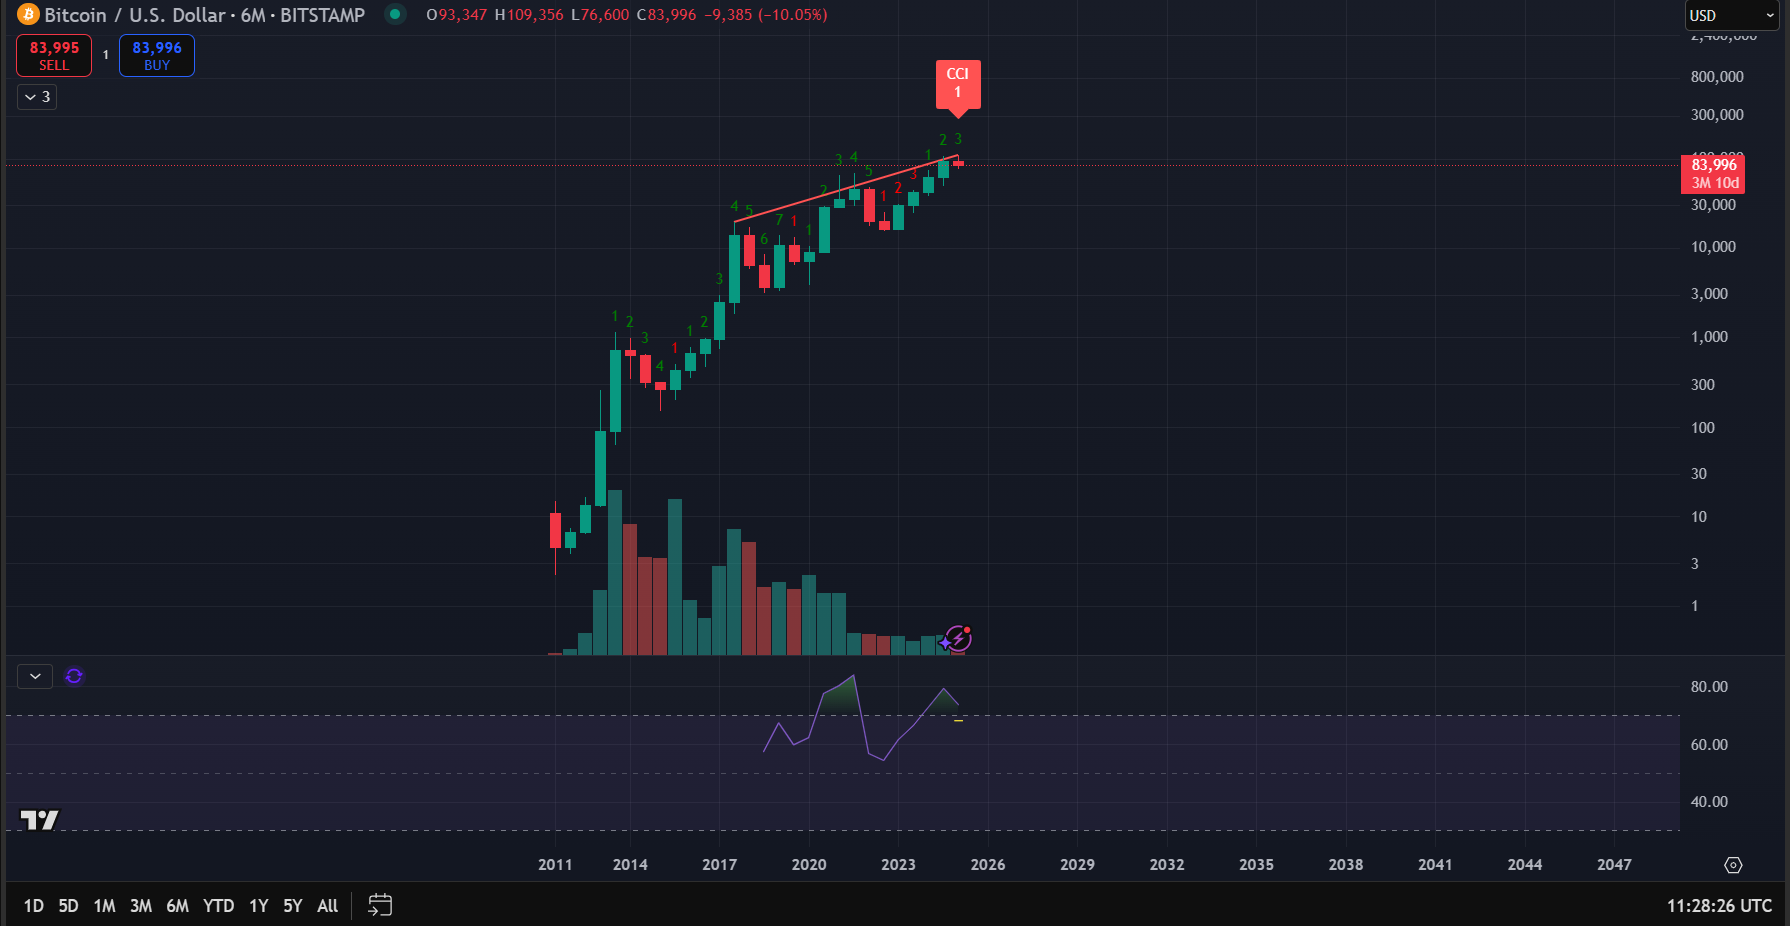
Six-Month Chart: A Major Sell Signal Has Triggered
For the first time ever, our custom indicator on the six-month chart has fired a bearish signal. This is unprecedented in Bitcoin’s history and aligns with the broader macro thesis of a stock market top. This has us very concerned.
Given the confluence of signals across multiple timeframes, this is a time to sell the rips or short the rallies. History suggests that Bitcoin may be entering an extended correction phase, and waiting for better re-entry points will be the optimal strategy. While long-term adoption remains intact, the short to medium-term outlook is looking increasingly bearish 📉🐻🔻🚨⚠️💀🔴.
Conclusion: Bitcoin has exhibited signs of exhaustion from its recent all time high of $109k, with key indicators aligning with past cycle tops. The monthly, three-month, and six-month charts all show major sell signals, suggesting the risk-to-reward ratio now favours defensive positioning 🐻✋🏼.
The smart move? Take profits, hedge positions, and prepare for volatility. If history is any guide, the best entries will come much lower in the cycle.
Want to be ahead of the curve? Subscribe to our Substack for more insights, strategies, and deep dives into the future of money.
Disclaimer: This is not financial advice. Always do your own research.