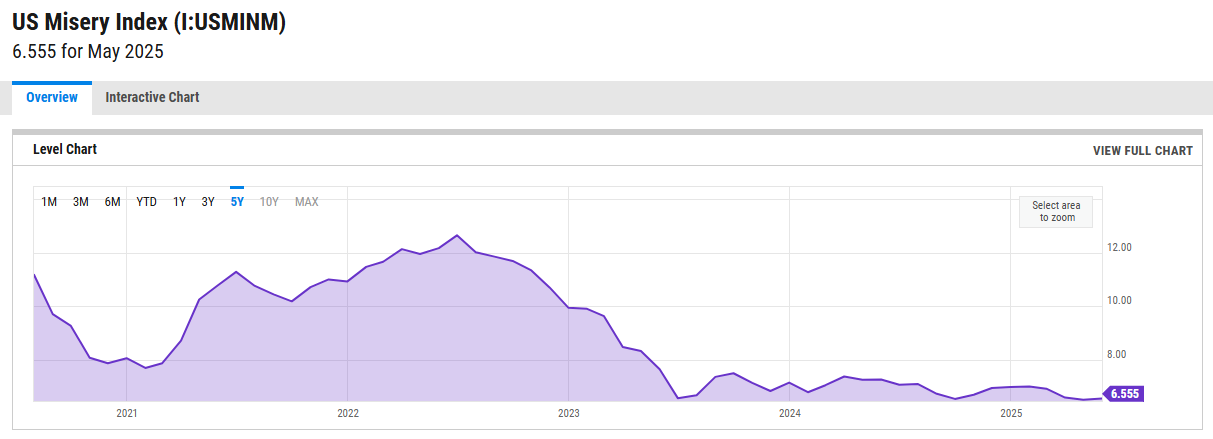
The Misery Index isn’t something you hear about daily on financial news, yet it can quietly signal the emotional pulse of an economy. First introduced by economist Arthur Okun, the Misery Index is the sum of the unemployment rate and the inflation rate. The logic is simple: high unemployment and high inflation both contribute to economic discomfort, so their combination offers a straightforward gauge of how “miserable” economic conditions feel for the average person.
While it was initially designed to illustrate economic pain, the Misery Index can also serve as a contrarian indicator for financial markets. Why? Because when misery is high, pessimism tends to peak, leading central banks to consider easing monetary policy or governments to push for stimulative measures. Conversely, when the Misery Index is low, optimism and complacency can reign just before the tide turns.
Misery (Movie) from 1990, for context. LOL.
Recent trends
Consider the data from the past few years:
In June 2022, the Misery Index stood at 12.66, reflecting high inflation pressures and persistent unemployment concerns.
By January 2023, it remained elevated at 9.91 but started trending lower.
Fast forward to May 2025 (the latest data available), and the Misery Index has dropped to 6.55, its lowest point in several years.
This decline mirrors broader narratives: inflation has eased, and employment has strengthened, which is undoubtedly positive for households. However, markets are forward-looking, and history suggests that periods of low “misery” can coincide with market tops, not bottoms.
Why a low Misery Index can be a contrarian indicator
When the Misery Index is low:
Consumer confidence often peaks.
Markets may become overextended, fuelled by easy conditions.
Investors may ignore underlying risks, chasing the last leg of a rally.
Historically, some market tops have formed during periods of economic euphoria, when inflation is under control, and unemployment is low. This environment can lead to central banks shifting from easing to tightening, or to valuations reaching unsustainable levels as optimism is fully priced in. Conversely, high Misery Index readings often align with market bottoms, as fear peaks, valuations reset, and policy responses are triggered to address widespread economic pain.
Where are we now?
With the Misery Index at 6.55 in May 2025, the lowest since before the 2021–2022 inflation shock, we should ask:
Are markets pricing in too much optimism?
Could this low point in misery be a signal that a market top is forming?
This doesn’t mean a crash is imminent, but it is a reminder to remain cautious when headlines and indicators suggest everything is going well. In markets, the time to prepare for risk is often when it feels least necessary.
Final thoughts
The Misery Index is a simple but powerful tool to understand economic sentiment. While it is reassuring to see it at multi-year lows, history teaches us that the best buying opportunities come when the index is high, and the best times to reduce risk are when it is low.
As investors, it pays to watch the Misery Index not just as a measure of economic pain but as a potential indicator of turning points in the markets. Now, with the index near its lows, it may be time to prepare for the possibility that the current optimism is pricing in perfection, just as the next cycle of challenges begins to form.


