
The global markets have peaked 📉🐻🔻🚨⚠️💀🔴, Here’s where the smart money is going next
Stocks are rolling over, bubbles are bursting, and the tide is turning. If you want to protect your wealth (or grow it), this is what to buy now.

We’re going to keep this article short, sharp, and to the point.
These insights are based on our proprietary algorithm, implemented through a custom TradingView Pine Script indicator. We’re convinced that the global markets have peaked, with liquidity steadily bleeding out of the system.
This decline is likely to intensify throughout the remainder of 2025 and become glaringly obvious by 2026. Now is the time to act, protect your wealth and position yourself wisely.
We are entering a Fourth Turning. You need to prepare now for its economic consequences.
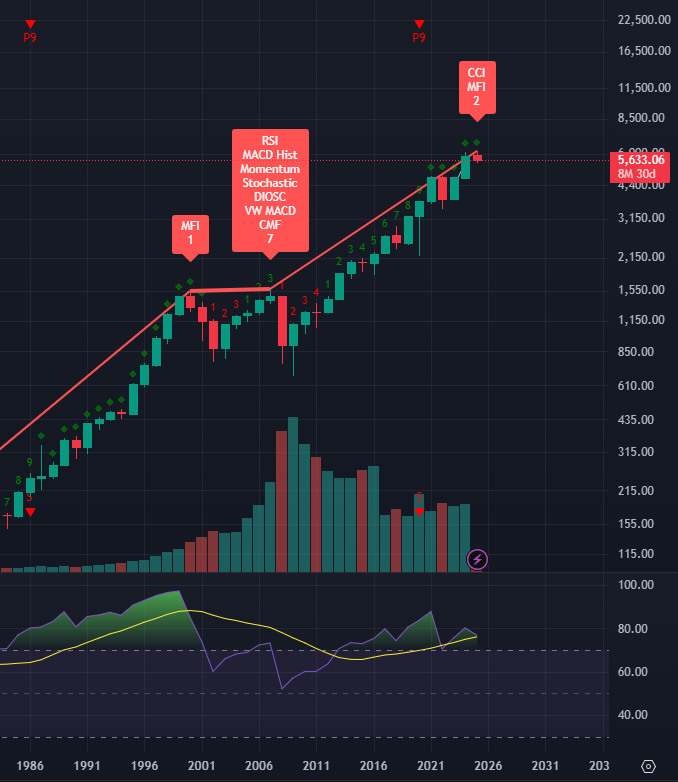
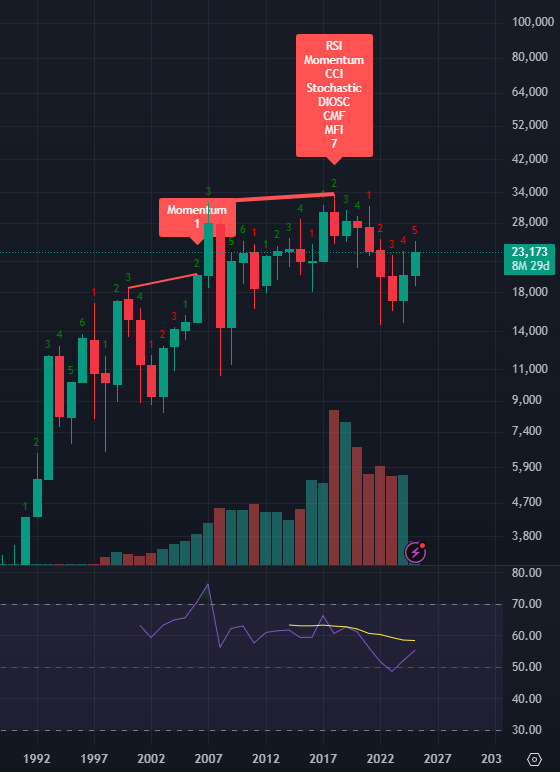
The S&P 500 Index (represented through the symbol ‘SPX’)
This is a yearly chart, with each candle representing 12 months.
Our indicator suggests that a crash in the S&P 500 has already begun, but the majority of investors haven't caught on yet.
Historically, this indicator has flashed at key turning points: in 2000, 2008, and now.
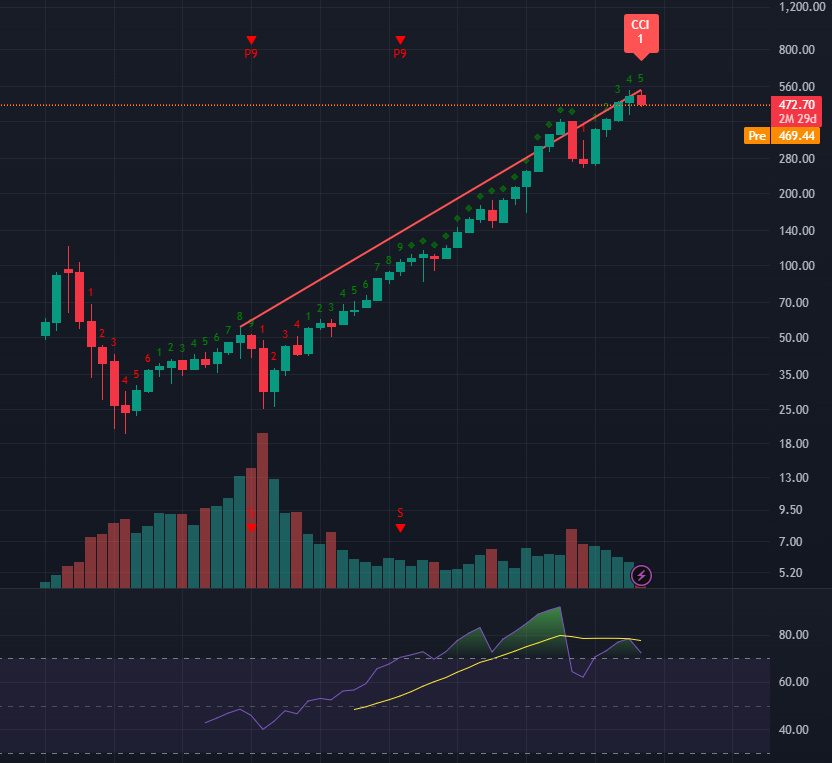
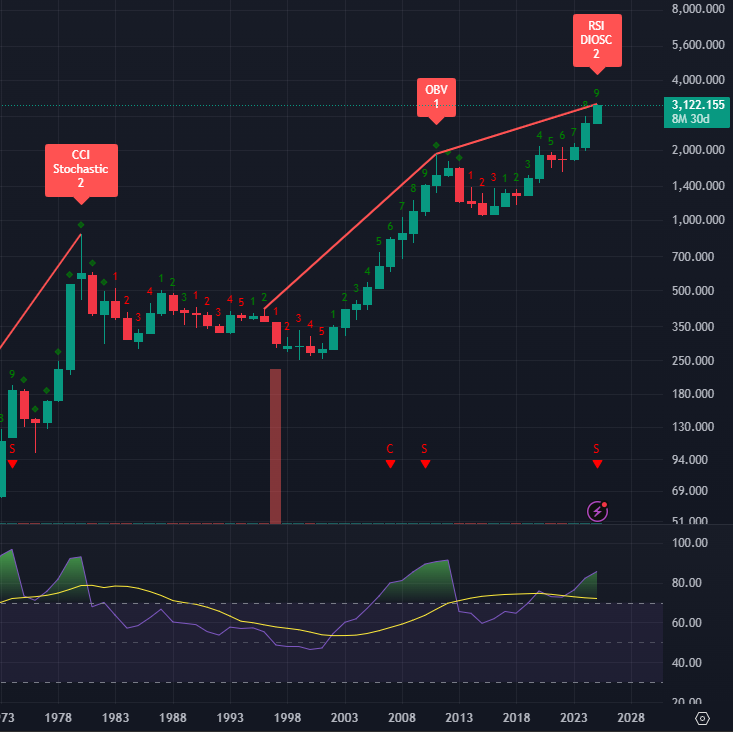
The NASDAQ Index (represented through the symbol ‘QQQ’)
This is a six-month chart, with each candle representing half a year.
The NASDAQ appears slightly more bullish and hasn’t yet triggered a yearly sell signal.
However, our indicator suggests that a crash in the NASDAQ has already begun and is likely to gather momentum, trailing just behind the S&P 500, as the majority of investors continue to “buy the dip”.
This is the first time in the history of the QQQ ETF that this indicator has triggered.
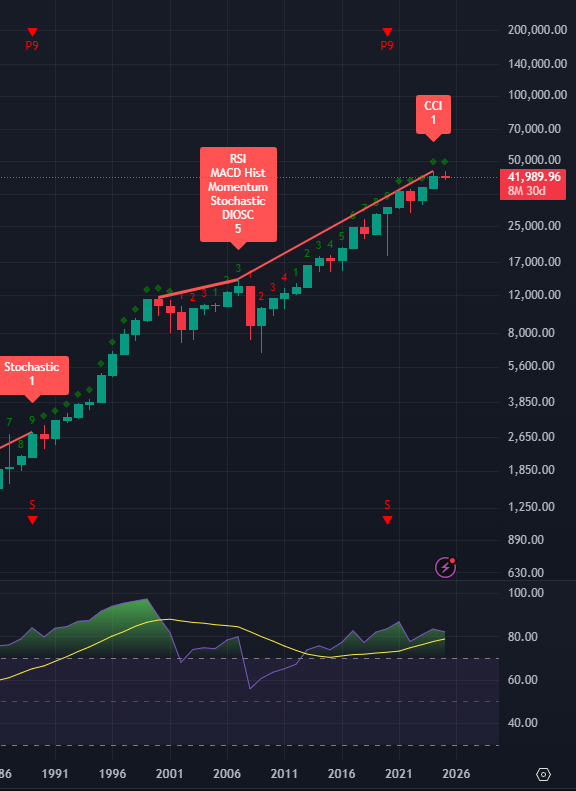
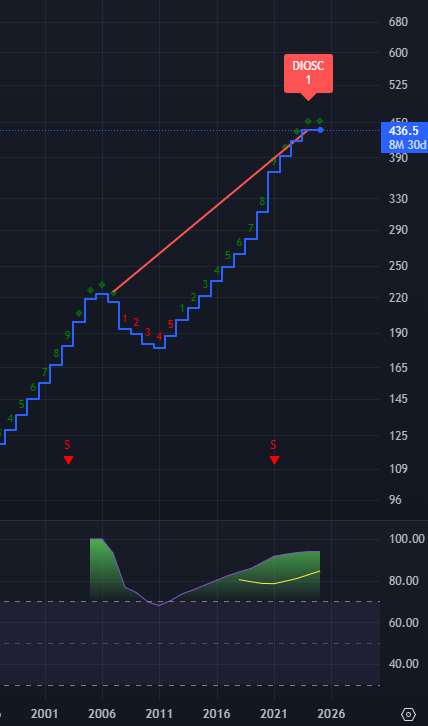
The Dow Jones Index, another major U.S. benchmark
This is a yearly chart, with each candle representing one year.
This index appears slightly more bullish, similar to the NASDAQ. However, it too is starting to show signs of rolling over. In recent history, our indicator has triggered on this index twice: in 2008 and now.
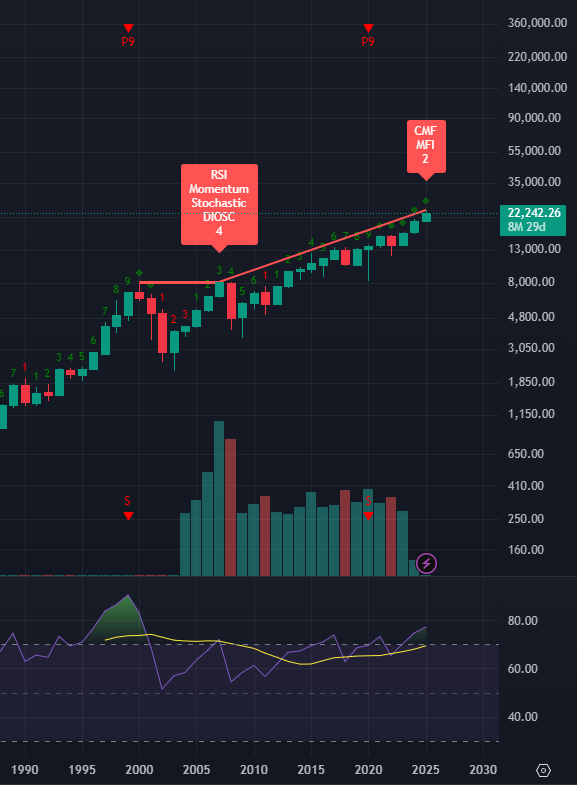
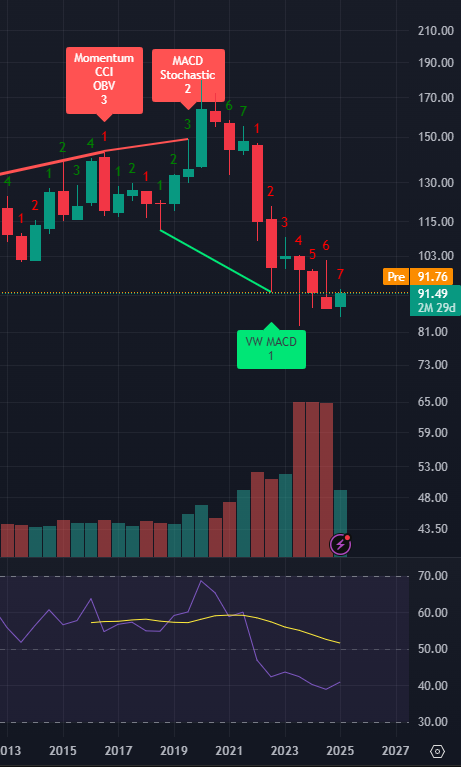
The German DAX Index (the strongest index in Europe)
This is a yearly chart, with each candle representing one year.
Our indicator shows that a crash in the German stock market (DAX) has just begun.
It has only flashed twice in recent history, in 2008 and now.
While the DAX may appear strong on the surface, it’s on the verge of rolling over.
The Chinese stock market, represented by the Hang Seng Index
This is a yearly chart, with each candle representing one year.
This chart indicates that the Chinese stock market peaked in 2018, just prior to the COVID-19 pandemic.
Our view is that China’s strict response to COVID, combined with its disastrous property bubble, has kept its markets suppressed ever since.
In many ways, China went first, and the rest of the world is now following.
Accordingly, China may be the first to emerge from the forthcoming global recession or depression, potentially reasserting itself as the next global leader.
What about Gold? Isn’t that a safe haven asset? Nope.
This is a yearly chart, with each candle representing one year.
According to our indicator Gold is in the process of peaking. In recent history our indicator predicted the gold decline in 1980, 2008 and now.
History shows that gold peaks just before a crisis, then sells off in it, swiftly recovering. We love gold, long term, just not at this price.
What about house prices, they won’t go down, will they?
This is a yearly chart, with each candle representing one year.
In short, yes, they will totally go down. Based on the chart below our indicator predicts that U.S. house prices are topping. Our indicator didn’t flash for the 2008 house crash, but it is now (on the yearly), which has us very worried.
This is the USHPI…
So, what is the play? How do we protect ourselves (or gain)?
This is a six-month chart, with each candle representing half a year.
In short, ‘bonds’. The TLT chart (which is representative of 10 year U.S. Treasuries), is in the process of bottoming. This, combined with the topping indicators shown above, strongly suggests that rates are about to gross, aggressively.
Our view is that most central banks are holding rates high (or cutting them slowly), as they know that the markets are about to roll over. They need ammo for their monetary guns, when the time comes. We expect to see 0.5% or 1% cuts in the forthcoming quarters, once the damage to stocks becomes unbearable.
As the price of bonds is inversely correlated to the interest rate, we expect to see long term bonds rally between 30 and 60%, whilst offering a sweet (locked in) yield, as represented by our current interest rates.
Final points
Global stock markets are showing signs of topping.
The 17 year bull market shows signs of slowing, and, ultimately, reversing.
We expect risk assets to sell off, aggressively.
We expect long term bonds to rally, considerably.
We expect gold to sell off, but recover sharply.
We expect a severe recession in late 2025, and definitely in 2026.
The inversion of the yield curve is screaming ‘sell’, for risk assets.
The money supply has been growing, but slower than the 6% PA average.
The lag affect of sharply raising rates is well overdue, and coming.
China will be the country that will benefit the most, coming out of recession first.
This calamity will be one for the books. Make sure that you protect yourself.
What about Bitcoin you say?
Well, we gave our view on that in an earlier article, available here.
If you enjoyed this article, please hit ❤️ or share it with a friend who’s still deluded enough to believe the markets will rise forever.
Show them the light, there was a time to buy the dip, but this isn’t it.